• Skip to main content
  • Skip to secondary navigation

David Pace, PhD, MBA

mostly fusion

  • CV
  • Research
  • Physics
  • Miscellany
  • Microblog
  • Connect
You are here: Home / Research / Energetic ion transport by microturbulence is insignificant in tokamaks

Energetic ion transport by microturbulence is insignificant in tokamaks

May 8, 2013 1 Comment

This paper means a lot to me. It has both a technical side and an emotional side.

The physics of this paper concerns how small scale turbulent fluctuations in the plasma (e.g., fluctuations of the plasma density) can affect the way that energetic ions move across the magnetic field. Fundamentally, the orbit size of these ions is much larger than the size of the turbulent eddys, meaning that an energetic ion passes through a randomized set of fluctuations and averages out their effect. The net effect, therefore, is roughly zero, meaning that the ion moves through the plasma as though the turbulence is not present at all.

The reason for writing this paper, however, is that a few years earlier there was a large collection of theoretical and experimental work that showed the turbulence can cause the ions to move around. Specifically, there was good reason to think that neutral beams (the energetic ions result from the ionization of the injected neutrals) were inefficient at heating the plasma and driving necessary current because of the turbulence pushing ions out before they did any good. One of my earlier papers also included a section that agreed with this and helped fuel the fire for worrying about turbulence in existing fusion reactors. After some improvements in diagnostic techniques and ion transport models it became apparent that the previous work must have been incorrect because our measurements never reproduced the previously reported effect. Thus, this paper was born. It has 24 figures and expands 18 pages in the PDF because that was the only way to present a comprehensive demonstration that this process cannot be occurring in present tokamaks.

“You can’t prove a negative,” was a common refrain uttered during discussions on how this paper was coming together. I decided to include a lot of detail in addition to a thorough review of past work (see Section II). My logic was to show how decades of past work suggested turbulence should not be able to noticeably transport energetic ions in existing tokamaks, and then to use that within the discussion of the more recent work in order to point out the flaws in those experiments (see Section VI. B).

It’s a bit of an emotional rollercoaster to begin a massive project expecting to advance a hot topic in science only to find out that it was mostly incorrect. Furthermore, the remaining challenge is to communicate the null result in a way that people will appreciate. The difficulty of this task is evident in the fact that the earlier works are still cited as proof that this is a big effect (even in cases where my paper is later cited), while in the more rare example, my paper is actually cited as supporting the opposite of its conclusion. That rare example is particularly frustrating because you would expect that reading the title alone should provide a pretty good overview of the conclusions. This is a wonderful experience, certainly, because it’s really just science working the way that it should. No matter what you may prove or suggest, that result needs to be reproduced and then disseminated.

The happy ending to this story is the fact that the paper was published at all. Negative results seem to have a problem getting published. In medical research, there is probably a bias against negative results that manifests as researchers simply not even trying to publish them. Some publishing companies are beginning to support the publication of null results, see Elsevier and PLOS, with the aim of reducing publication bias, but it’s definitely rare to see this in fusion research.

This paper appears in Physics of Plasmas as,
D. C. Pace (庞大卫), M. E. Austin, E. M. Bass, R. V. Budny, W. W. Heidbrink,
J. C. Hillesheim, C. T. Holcomb, M. Gorelenkova, B. A. Grierson, D. C. McCune,
G. R. McKee, C. M. Muscatello, J. M. Park, C. C. Petty, T. L. Rhodes, G. M. Staebler, T. Suzuki, M. A. Van Zeeland, R. E. Waltz, G. Wang, A. E. White, Z. Yan, X. Yuan, and Y. B. Zhu, Phys. Plasmas 20, 056108 (2013).

You can download the Version of Record (PDF, 3.9 MB).

Energetic ion transport by microturbulence is insignificant in tokamaks

Abstract

Energetic ion transport due to microturbulence is investigated in magnetohydrodynamic-quiescent plasmas by way of neutral beam injection in the DIII-D tokamak [J. L. Luxon, Nucl. Fusion 42, 614 (2002)]. A range of on-axis and off-axis beam injection scenarios are employed to vary relevant parameters such as the character of the background microturbulence and the value of E_b/T_e, where E_b is the energetic ion energy and T_e the electron temperature. In all cases, it is found that any transport enhancement due to microturbulence is too small to observe experimentally. These transport effects are modeled using numerical and analytic expectations that calculate the energetic ion diffusivity due to microturbulence. It is determined that energetic ion transport due to coherent fluctuations (e.g., Alfvén eigenmodes) is a considerably larger effect and should therefore be considered more important for ITER.

I. INTRODUCTION

The viability of the tokamak [1] approach to fusion energy is dependent on the ability to magnetically confine fusion-produced α-particles such that they transfer their energy to the background plasma and thereby sustain a burning regime. In addition to α-particles, present day tokamaks and ITER [2] are concerned with the transport properties of energetic ions sourced by auxiliary heating and current drive methods such as neutral beam injection (NBI) and ion cyclotron resonance heating (ICRH). For NBI and ICRH, energetic ion confinement determines the efficiency of current drive or heating. A great deal of attention is now given to the transport effects of coherent modes that are driven by the energetic ion population, such as Alfvén eigenmodes [3] (AEs). Indeed, reviews of the status of energetic ion research have evolved from basic principles [4] to a focus on Alfvénic physics [5].

A recent joint experiment [6] conducted through the International Tokamak Physics Activity (ITPA) directed attention to the possibility that microturbulence significantly enhances neutral beam ion diffusion in cases of off-axis neutral beam current drive (NBCD). Conceptually, this occurs because off-axis neutral beam injection places a large population of beam ions in the mid-radius region of the plasma where microturbulence is strong. On-axis NBCD, by contrast, is centrally peaked, thereby placing beam ions in the region where microturbulence is weak or nonexistent. New results show that measured radial profiles of off-axis NBCD agree with modeled expectations over an ITER rele- vant parameter range in high performance plasmas. [7] The results shown in the present paper are concerned with lower confinement (L-mode) plasmas in which large amplitude microturbulence is present. Off-axis and on-axis NBI is used, alongside detailed measurements of the beam ion and plasma profiles, to investigate the possible contribution of microturbulence to the transport of energetic ions. To experimentally isolate microturbulence-induced beam ion transport requires the absence of magnetohydrodynamic (MHD) activity, such as Alfvén eigenmodes and sawtooth oscillations. Such MHD-quiescent tokamak plasmas from DIII-D [8,9] are presented in this work, and the resulting analysis of energetic ion transport indicates that microturbulence is an insignificant transport mechanism for the energetic ion population.

This paper is organized as follows: Sec. II gives a review of experimental and theoretical results concerning energetic ion transport and the possible effects of microturbulence. The experimental setup, including diagnostics and NBI geometry, is given in Sec. III. Results from off-axis NBI are given in Sec. IV, followed by on-axis NBI results in Sec. V. The discussion of Sec. VI summarizes the results, treats previously reported experimental results, and considers the difficulties in investigating the “low-energy” region of the energetic ion population. Finally, the conclusions are presented in Sec. VII.

II. BACKGROUND

Given that previous reviews [4,5] of energetic ion transport in tokamaks have neglected the effects of microturbulence, we present here a review of experimental and theoretical results in this context. The intention is to demonstrate both the strong theoretical basis for interaction between energetic ions and small-scale fluctuations, and the large body of experimental work that indicates these interactions lead to insignificant changes in tokamak plasma behavior. It remains to be seen whether microturbulence effects on energetic ions will be fundamentally different in the burning plasma regime achieved in ITER [10].

A. Experiments and modeling

Enhanced energetic ion transport due to the presence of microinstabilities is well established by basic plasma experiments. Here, the energetic ions feature gyroradii that are much larger than the cross-field scale of the fluctuations (though this is varied in course of the studies, as will be discussed below). These experiments provide excellent diagnostic access as the electron temperatures are typically T_e \le 10 eV, while the energetic ion source is well characterized with beam ion energy E_b \le 1000 eV. These experiments are conducted in both linear and simple toroidal geometry.

Early experiments in a linear device, the LAPD [11] showed that both the energy slowing down and spatial diffusion of energetic ions (E_b \approx 350 eV with T_e \approx 0.2 eV) are classical [12] These observations were made in the LAPD afterglow for which the thermal background plasma transport is separately known to be classical [13] (i.e., there are no pressure gradients or turbulent fluctuations). In order to study energetic ion transport due to turbulence, an experiment [14] was conducted in the main discharge with a copper plate covering half of the cathode in order to create a large pressure gradient. Firing a lithium beam with E_b = 400-1000\,eV into this plasma with T_e \approx 5\,eV and density fluctuation level \delta n/n \le 80\% produced beam widening beyond that expected from the classical effects of collisions and beam divergence. This transport enhancement increases as E_b is reduced and the beam ion gyroradius approaches the radial scale length of the fluctuations. Injecting the beam outside of the pressure gradient region produces classical profile spreading. These results motivated additional work [15] in which the beam ions were held fixed while the turbulence scale size and correlation length was changed through variations in plasma species and biasing of the cathode blocking plate. Beam ion turbulent transport was dominated by a gyrocenter drift while the ion energy change was essentially zero. Regimes of subdiffusive and diffusive transport indicate the rich physics involved in this interaction.

A great advance in the understanding of energetic ion interactions with plasma turbulence has been achieved through experiments and modeling of the simple magnetized torus TORPEX [16]. Initial experiments [17] showed that firing lithium ions of E_b = 300-600\,eV (T_e \approx 5-15\,eV) through regions of plasma turbulence, including larger scale structures known as blobs [18], resulted in broadening of the beam profile beyond classical expectations. The well characterized turbulence of TORPEX encouraged theoretical work that used the experimental parameters for modeling of energetic ion transport at these parameters. Regimes of sub- and superdiffusion are identified by a theoretical treatment [19] that combines fluid turbulence simulations with energetic ion orbit following. Superdiffusive transport occurs when the turbulent potential structures are static with respect to the energetic ion motion. Of particular importance for future considerations in tokamak geometry, the energetic ion transport becomes subdiffusive when the particles cross the turbulent structure vertically faster than radially, a process which serves to decorrelate the ion from the turbulent structure and reduce its transport. This led to a Levy walk description of the energetic ion diffusion [20] in which the different transport regimes were characterized according to the ratio of ion energy to plasma temperature, E_b/T_e: E_b/T_e = 5 is superdiffusive, E_b/T_e = 25 is diffusive, and E_b/T_e = 250 is subdiffusive. Describing the effective particle diffusivity in terms of this ratio is a hallmark of theory applicable to tokamaks. A detailed treatment [21] focusing on interchange mode turbulence within TORPEX parameters reproduces many features observed in the experiment and has motivated additional hardware development (i.e., toroidal position adjustment of the beam) for future comparisons.

While basic plasma devices have conclusively demonstrated the ability of microturbulence to enhance the transport of energetic ions, the experimental evidence from tokamaks overwhelmingly shows that the effect is negligible. These studies include both fusion-produced 3.5\,MeV \alpha-particles and energetic ions resulting from NBI and ICRH. Energetic ion diffusivities, D_\text{EI}, were determined from measurements many times on TFTR [22]. It must be noted that these studies, including the theoretical references and the new experiments presented later, use D_\text{EI} to represent the diffusivity due to unidentified, or anomalous, mechanisms (the term “anomalous diffusivity” is often used to describe turbulence-induced diffusivity). A value of D_\text{EI} = 0 corresponds to transport that is accurately described by the neoclassical effects of collisions and particle drifts. In TFTR, the 1 MeV tritons and 3\,MeV protons resulting from DD fusion were observed [23] to agree with models setting D_\text{EI} = 0, though measurement uncertainty required an upper bound of D_\text{EI} < 0.1\,m^2/s. These shots were deemed free of large scale MHD, and they utilized a range of plasma parameters achieved with neutral beam heating powers of P_\text{NB} = 5-12\,MW. Instances of anomalous fusion product transport and loss were observed [24], but only in plasmas featuring a smaller major radius (R = 2.45\,m compared to the more typical 2.6\,m). This transport enhancement was ubiquitous with the altered shape, including low confinement plasmas and the high confinement “supershots” that featured P_\text{NB} = 32\,MW, and it was determined [25] that the transport mechanism could not be related to plasma fluctuations because all fluctuation characteristics varied widely across the range of plasmas observed. Modeling of ripple diffusion in these cases eventually provided [26] a qualitatively accurate description of the observations. Fusion \alpha-particle transport was observed [27] to follow neoclassical slowing down behavior, where measurements [28] extended into the range of E_b/T_e \ge 18 (here, E_b = 150-600\,keV is the \alpha-particle energy) and the slowing down time of \tau_s\approx 0.5\,s provided ample time for transport enhancements to manifest. Throughout the course of experiments at TFTR, some anomalous fusion-product transport was observed in DD plasmas, but not in DT plasmas [29].

Beam ion transport was also studied extensively on TFTR. The experimental method involves measuring properties that are sensitive to the beam ion profile and density such as the neutron rate and plasma stored energy. Values for D_\text{EI} were provided to TRANSP, [30] which then modeled the expected plasma response to the enhanced beam ion transport. This work [31] found instances of D_\text{EI} < 0.2\,m^2/s across a range of high-power DT shots. Modeling of experiments [32] that used only neutron decay following short beam pulses determined core values of D_\text{EI} < 0.05\,m^2/s. These values of D_\text{EI} were modeled across the entire plasma profile, which seemed inconsistent with experimental indications that beam ion confinement in the core was much better than that in the outer half of the plasma. Refinements to the modeling were made to allow defining D_\text{EI} = D_\text{EI}(r), where r is the plasma minor radius. Later work [33,34] found that the beam ion transport enhancement was consistent with a large diffusivity increase at the radial position corresponding to the stochastic ripple loss region. These results were applicable across a range of both Ohmic (beam pulses for energetic ion seeding and diagnostics only) and high-power supershots. Remaining cases of anomalous beam ion diffusion are reported [35] in reversed shear plasmas. Neutron profiles show that these beam ions are lost, however, and not merely redistributed. It is noted that no significant MHD was observed, though the reversed shear nature of these shots suggests that Alfvén cascades [36] may have been present but not detected. While sensitive edge magnetics similar to those available on TFTR have detected cascades previously,[37] the most detailed and systematic observations have been made with fast time-resolved interferometers that pass near the center of the plasma. [38,39]

Results from other tokamaks provide additional examples of either classical transport or initially anomalous energetic ion transport that is eventually explained in terms of non-microturbulence features. Fusion-produced 1\,MeV tritons experienced enhanced transport in JT-60U that was determined to be caused by ripple diffusion. [40] A similar fusion-product study [41] at DIII-D concluded neoclassical transport accurately accounted for measurements across a range of plasmas including the “very high” confinement (VH-mode) shots in which the confinement times were twice as long as in standard H-modes. These experiments also highlight the strong transport effect of MHD; the highest toroidal \beta values achieved at the time (\beta_\phi = 11.1\%) demonstrated that reductions in MHD levels led to measurable improvements in energetic ion confinement. Anomalous diffusion of tritium beam ions is reported [42] in JET in the case of reversed shear profiles. In this case, however, the measured plasma parameters are better modeled by using D_\text{EI} = 0 and reducing the beam power (i.e., reducing the number of injected beam ions) than by setting D_\text{EI} > 0 alone. Again, this result is applicable to a range of plasma parameters including low confinement shots. The required beam power reduction is greater than the experimental uncertainty in the beam power, but it is noted that previous campaigns in which the beam-beam neutron component was smaller did not require such power reductions to reproduce experimental observations.

In contrast to the studies referenced above, three recent cases seem to support the concept of measurable beam ion diffusion due to microturbulence. These cases occur during off-axis NBCD scenarios and they are summarized in Ref. 6. ASDEX Upgrade observes [43] absolute levels of off-axis NBCD that are smaller than the expected values based on neoclassical theory. The broadened beam ion profile is consistent with D_\text{EI} = 0.5\,m$^2$/s, implying a considerable transport mechanism. Off-axis NBCD at DIII-D produced an example [44,45] of a similar process, with the transport enhancement increasing with P_\text{NB} (since the beam energies are fixed at E_b \approx 80\,keV, this corresponds to a decreasing E_b/T_e). A value of D_\text{EI}(r) = 0.5\chi_i(r), where \chi_i is the power-balance computed ion thermal diffusivity, did not reduce the energetic ion density enough to agree with the experimental profile, and further increasing D_\text{EI} produced greater discrepancy between the measured and simulated profile shapes. Noting that the computed \chi_i is typically an order of magnitude larger than the neoclassical \chi_i, this is another case demonstrating a very large transport enhancement (D_\text{EI} peaked at approximately 1\,m^2/s for E_b = 40\,keV). [44] For context, empirical studies at DIII-D found [46] that a constant D_\text{EI} = 0.3\,m^2/s is typically sufficient to account for transport of energetic ions due to Alfvén eigenmodes, while recent experiments [47] showed that neutron rates asymptote to the D_\text{EI} = 0 calculation as AE activity decays away. A separate case investigated the transport enhancement by using on-axis beam injection at reduced energy, E_b = 58\,keV, along with spectroscopic techniques to show [48] that beam ion diffusion was larger than neoclassically expected for E_b \lesssim 30\,keV (plasma temperatures were not reported for that plasma). Finally, JT-60U reported [49] off-axis NBCD profiles that disagreed with theoretical expectations. While this work concluded that beam ion diffusion is an unlikely explanation for the disagreement, it is still cited as a motivation for investigations into the possible effects of microturbulence on beam ions. A review of these results, in the context of the new observations presented here, will be given in Sec. VI.

B. Theory and simulation

A considerable amount of theoretical and simulation work has been completed in the area of energetic ion transport by microturbulence. In the summary presented below, the energetic ions are treated as passive tracer particles, i.e., they do not drive instabilities due to their own pressure gradients. A rigorous study [50] concerning the applicability of tracer particle analysis in determining turbulent transport found that in many cases this is a suitable method (Fick’s law must hold for the system). Early work focused on the importance of confining fusion \alpha-particles, with an analytic theory review [51] prioritizing ripple and low-n (toroidal mode number) MHD well ahead of transport due to microturbulence. The work of Ref. 51, now more than 20 years old, described the importance of electromagnetic turbulence over electrostatic for \alpha-particles (a result also determined from more recent work [52] indicating energetic ion diffusion due to electromagnetic turbulence is invariant with ion energy), though even the electromagnetic contribution, with D_\text{EI} \approx 0.062 m^2/s, is small compared to the transport from MHD. An account of the expected \alpha-particle diffusivity due to MHD (as motivated by the experiments of the time, and using the ITER parameters of the time) showed [53] that the \alpha-particle heating efficiency decreased to a possible ignition-preventing level of 95\% in the case of D_\text{EI} \ge 3.0\,m$^2$/s. A detailed accounting of those calculations given in a separate work. [54]

Early simulations of particle and energy transport in turbulent fields found [55] that diffusivity is reduced as the particle gyroradius increases. In later simulation work [56,57] it was suggested that the reduction in turbulent diffusion as a function of particle gyroradius could be used to determine the character of the turbulent fluctuations. Tracer particle simulations found [58] that increasing gyroradius greatly reduces the resultant particle transport, while confirming that the diffusive response to a turbulent field still holds. Other simulations show [59] that the turbulent diffusion of particles actually increases with gyroradius if the correlation time of the turbulent potential fields is similar to the effective time of flight of the guiding center. This is the drift transport coefficient, however, while the total diffusion coefficient is still reduced compared to thermal particles. Building on this work, other numerical simulations reproduced [60] the key features and stated that fusion $\alpha$-particles will likely suffer from significant turbulent transport because the turbulence correlation lengths will be comparable to the \alpha-gyroradius.

The continued advancement of gyrokinetics and its associated computing framework have allowed it to extend beyond thermal plasma transport. The gyrokinetic formulation was rederived [61] with consideration for the effects of highly energetic ions. The suprathermal component was limited to the field-parallel velocity term, with the perpendicular energy set equal to T_e. Turbulent diffusivity of energetic ions peaked at energies for which the particles’ curvature drift velocity matched the diamagnetic drift velocity of the turbulence. The largest transport effects were seen at comparatively low energies, E_b \lesssim 3T_e. GYRO [62] simulations demonstrated [63] that \alpha-particles will suffer transport due to microturbulence in ITER. Simulations using the GENE [64] code identified [65] a complex interplay between different parameters, including effects due to poloidal drifts. That work noted significant turbulent transport of energetic ions should occur when the particle gyroradius is comparable or smaller than the turbulence correlation length. Subsequent simulations [66] provided a detailed discussion of energetic ion orbit averaging and turbulence decorrelation physics and used ITER parameters to show a large Kubo number (defined in Ref. 43 as K = V_{E\times B}\tau_c/\lambda_c, where V_{E\times B}=900,m/s is the E\timesB velocity, \tau_c = 1.8\times 10^{-4}\,s is the turbulence correlation time, and \lambda_c = 1.6\,cm is the turbulence correlation length) of K = 10, which is large enough for a transport enhancement to manifest.

Simulations with the particle-in-cell code GTC [67] identified [68,69] scalings of the energetic ion diffusivity in the presence of ion temperature gradient (ITG) type turbulence. For passing energetic ions, this goes as D_\text{EI,pass} \propto T_e/E_b, while for trapped ions the relationship is D_\text{EI,trap} \propto (T_e/E_b)^2. Other simulations with GENE identified [52] the same dependence for passing ions, but differed in the trapped dependence with D_\text{EI,trap} \propto (T_e/E_b)^{3/2}. The difference in trapped ion response stems from calculations of orbit averaging and decorrelation with turbulent potential structure, a subject that is in ongoing debate. [70,71] Simulations focusing on trapped electron mode (TEM) type turbulence reproduced [72] D_\text{EI,trap} \propto (T_e/E_b)^2, and, together with ITG-type simulations, [73] identified that the diffusive/subdiffusive behavior is dictated by machine size. Recent GYRO simulations [74] indicate a stronger falloff for both passing ions, (T_e/E_b)^{3/2}, and trapped ions, (T_e/E_b)^{5/2}. The effects of zonal flows have been studied, [75] and the results indicated an increase in poloidal diffusion of energetic ions, with a simultaneous decrease in radial diffusion. Many of these simulations treat the energetic ion population as an extra hot Maxwellian, which has been shown [76] to produce results that are consistent with simulations employing the more realistic slowing down distribution.

A large set of ITER-relevant modeling and simulation with GENE has found [77,78] values of D_\text{EI} > 0.1\,m^2/s through the MeV ion energy range. Later work [79] reviewed NBI (E_b = 1\,MeV) in ITER and determined that expected NBCD profile modification was minimal. It is worth noting that work considered fractional beam energy components (E_b/2 and E_b/3) that arise in standard neutral beams from molecular deuterium,[80] but MeV beams in ITER will use negative neutral sources [81] that produce only the full energy component. The inclusion of lower energy beam ions should tend to increase the modeled effect of turbulence-induced diffusion. If the beam energy is lowered to 300\,keV and moved to \rho = \sqrt{\psi_t/\psi_t(a)} = 0.5 (where \psi_t is the toroidal magnetic flux and a is the minor radius) resulting in E_b/T_e = 20, then changes in the NBCD profile were observed on the order of 5\%. Predictions [82] for energetic ion transport due to turbulence in DEMO [83] and TCV [84] suggest new regimes that might provide strong experimental evidence for the effect. The TCV scenario depends on the completion of a neutral beam upgrade. [85] The most thorough and complete investigation of this transport mechanism for burning plasmas is contained in the thesis of Albergante. [86] The most recent work [87] on this topic provides analytic expressions for expected D_\text{EI} in terms of experimentally accessible parameters. These expressions are used in the modeling performed for the present experiments.

III. EXPERIMENTAL SETUP

A. Typical plasma parameters and NBI

FIG. 1. Time evolution of plasma parameters from shot 145183 indicating the regions of energetic ion transport mechanisms and the presence of off-axis NBI. (a) Line-averaged density, (b) central electron temperature, (c) plasma current, (d) neutron rate, and (e) neutral beam power.

A series of low confinement mode (L-mode) plasmas are presented in this paper. The time evolution of one such shot is shown in Fig. 1, and is representative of the qualitative behavior of the plasmas in general. On-axis beam injection during the current ramp drives Alfvén eigenmodes, [88] which must be avoided due to their significant transport effect on beam ions. A steady electron density [from interferometry, [89] Fig. 1(a)] and central temperature [from electron cyclotron emission, [90] Fig. 1(b)] is maintained after reaching flattop [Fig. 1(c)]. The neutron rate [91] [Fig. 1(d)] is modulated according to the injected P_\text{NB} [Fig. 1(e)]. Off-axis NBI replaces the on-axis beams during the flattop and is maintained for multiple beam ion slowing down times. The total injected beam power remains constant (below 5 MW in all shots) and \beta_N \leq 0.56. The MHD-quiescent period, indicated as the shaded region in Fig. 1, occurs before the appearance of sawteeth. Characteristics of the turbulent fluctuations are presented within the analysis of particular shots.

In order to inject P_\text{NB} \ge 4\,MW while avoiding confinement transitions, the plasmas are operated in the unfavorable \vec{\nabla} B-drift direction. Figure 2 shows the equilibrium shape for shot 145183 at t = 1585\,ms. The last closed flux surface (solid blue line) and the mid-radius position of \rho = 0.5 are shown. The color contour represents the birth pitch (v_\parallel/v, where v_\parallel is the particle velocity along the magnetic field and v is the total velocity, though the sign of v_\parallel is determined according to the plasma current) of the off-axis injected neutral particles. This beam ion birth profile is calculated with NUBEAM (Sec. IIIC). Performance of the off-axis beams is extensively studied and NUBEAM modeling of the injection is validated, where initial discrepancies appear related to uncertainties in beam power, [92] but not anomalous transport mechanisms.

FIG. 2. Magnetic equilibrium from shot 145183 at t = 1585 ms. Color contour represents the birth pitch of off-axis injected neutral beam particles.

B. Measurements of turbulence and energetic ion transport

The primary energetic ion diagnostic is the fast ion D_\alpha (FIDA) system, [93] which is a spectroscopic measurement enabled by charge exchange between energetic ions and injected neutrals. The charge exchange process results in a favorable situation of excited-state fast neutrals that then emit Doppler shifted photons, providing a spatially localized signal with energy resolution of the energetic ion profile. [94] Each FIDA chord, with its associated viewing geometry, features a unique sensitivity across the phase space of the energetic ion distribution. [95] Figure 3 provides an example of one such phase space weighting for the R = 1.97\,m chord during t = 1585\,ms in shot 145183. This calculation convolves the diagnostic viewing geometry with the charge-exchange probability and the energetic ion distribution (calculated with D_\text{EI} = 0). The contour indicates the contribution of different parts of the energetic ion distribution to the FIDA signal, i.e., the integral over this contour is 100\%. The dominant region of the distribution, in this example, is E_b > 40\,keV and v_\parallel/v > 0.5. The overlaid lines represent the trapped/passing boundary as determined with the constants-of-motion orbit code described in Ref. 47. Passing ions, which are responsible for driving current, make the largest contribution to this FIDA signal. A thorough treatment of this type of phase space weighting is given in Ref. 96, where those results for a collective Thomson scattering diagnostic translate directly to FIDA systems. Of relevance to the present investigation, it is noted that early FIDA diagnostic development demonstrated [97] that measured energetic ion profiles were classical across a range of MHD-quiescent plasmas (including variations in plasma conditions and beam power).

FIG. 3. Phase space weighting of the FIDA chord at R 1.97 m in shot 145183.

A view of typical radial positions for a variety of diagnostics is shown in Fig. 4. Turbulent fluctuations are measured by multiple systems. Beam emission spectroscopy (BES) [98] measures electron density fluctuations, thereby providing \tilde{n}_e/n_e, and turbulence correlation lengths. BES is sensitive to the wavenumber range k_\theta\rho_s < 0.5, where k_\theta is the poloidal wavenumber and \rho_s is the thermal ion sound gyroradius. The Doppler backscattering system (DBS) [99] measures density fluctuations and the velocity of turbulent structures through an intermediate range of k_\theta\rho_s < 2. Electron temperature fluctuations are documented by the correlation electron cyclotron emission system (CECE) [100] with sensitivity of k_\theta\rho_s < 0.3. The CECE diagnostic is coupled with an X-mode reflectometer that measures density fluctuations within the same sampling volume. This combination allows for determination of the coherency and phase angle between density and temperature fluctuations. [101,102]

FIG.4. Magnetic equilibrium from shot 142358 at t = 1525 ms showing typical positions of the FIDA (vertical black lines), BES (green rectangle), CECE/reflectometer (blue ovals), and DBS (red ovals) views.

C. Beam ion modeling

FIG. 5. Beam ion distributions calculated by NUBEAM with varying number of ions followed: (a) 10^6, (b) 10^5, and (c) 10^4.

The NUBEAM [103,104] module of TRANSP is used to simulate neutral beam injection in the DIII-D shots described here. NUBEAM is a Monte Carlo code that incorporates the beam geometry and injected power, along with measured plasma profiles, to calculate beam ionization profiles and subsequent beam ion slowing down. Experiments have verified [45] NUBEAM’s ability to accurately describe the beam ion population (the anomalous examples [44,45,48] are discussed in Sec. VI). The beam ion distribution, F_\text{b} = F_\text{b}(E_b, v_\parallel/v) calculated by NUBEAM is passed to the synthetic diagnostic code FIDASIM [105] to simulate the expected FIDA signals. The distribution is calculated with neoclassical transport effects by default, and an additional diffusivity may be provided to simulate enhanced transport regimes (e.g., due to coherent MHD or microturbulence). This anomalous diffusivity can be provided as D_\text{EI} = D_\text{EI}(E_b, v_\parallel/v, \rho, t), where the pitch dependence is coarse grained into six categories of trapped or passing topology. As this is a Monte Carlo code, care is taken to ensure that a sufficient number of ions are modeled in order to provide suitable input to FIDASIM. Earlier work [31] with the Monte Carlo beam ion modules of TRANSP reported a noise level of 5\%. Figure 5 presents F_bV contours, where V is the local Monte Carlo zone volume, for three different settings of the number of followed ions in NUBEAM. These distributions from shot 145183 are averaged over a short time period of 20 ms centered on t = 1585\,ms. The distribution computed by following 10^6 particles as shown in Fig. 5(a) is noticeably smoother than the one with 10^4 particles shown in Fig. 5(c). All FIDASIM simulations are performed using F_b from NUBEAM calculations using at least 10^5 particles, and an example F_b is shown in Fig. 5(b).

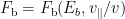
IV. RESULTS DURING OFF-AXIS NBCD

FIG. 6. Plasma profiles from shot 145183 indicating the individual measurements along with best-fit splines (solid lines) and statistical uncertainty range (dashed lines). Profiles are shown for (a) electron density, (b) electron and ion temperature, and (c) toroidal rotation.

Off-axis NBI is investigated due to its particular relevance for ITER, in which all of the heating and current drive beams will be off-axis (e.g., a modeled beam ion profile peaked at \rho \approx 0.2 is shown in Ref. 106). Since beam ions are injected across the mid-radius of the plasma in this mode of operation, it may be expected that diffusion due to microturbulence constitutes an important transport effect. The time evolution of off-axis NBI shot 145183 is shown in Fig. 1. Off-axis NBI begins at the current flattop and is maintained for a short time period before the time region of analysis. This shot features P_\text{NB} = 2.1\,MW of off-axis injection with a deposition profile as shown in Fig. 2. Radial profiles are presented in Fig. 6, including electron density [Fig. 6(a)], electron and ion temperatures [Fig. 6(b)], and toroidal rotation [Fig. 6(c)]. These data are collected by Thomson scattering, [107] electron cyclotron emission (ECE), and charge-exchange emission spectroscopy (CER). [108] Solid lines represent the best-fit splines to the individual measurements, and the resulting reduced-\chi^2 (hereafter written \chi^2_\text{red}) is indicated. Electron and ion temperatures are similar across the profile, with T_e surpassing T_i in the center of the plasma. For context with the existing theoretical scalings, this shot features E_b/T_e(0) \approx 30 during the period of interest. Significant fluctuation levels due to background microturbulence are observed. Figure 7 plots power spectra of electron temperature fluctuations in which the fluctuation level approaches \delta T_e/T_e \approx 1\%. Density fluctuations are observed with comparable spectra and slightly lower amplitude. The neutral beam viewed by the BES system is the one that tilts to provides off-axis injection, which limits the innermost radial position for which plasma density fluctuations can be measured.

FIG. 7. Spectra of electron temperature fluctuations in shot 145183.

Energetic ion diffusion due to microturbulence is modeled with two independent methods in this shot. In each case, these models produce values of D_\text{EI} that are passed to NUBEAM. One method uses the newly developed code DEP. [74] DEP is a quasilinear model in which the ratio of energetic ion turbulent diffusivity matrix elements to \chi_i is calculated in radial and velocity space. Only matrix elements for radial diffusion driven by radial gradients are used, i.e., velocity gradients are ignored. For modeling, the values of D_\text{EI} are determined by,

(1) D_{EI}(E_b,\Lambda) = \left(\frac{D_{EP}}{\chi_i}\right)_\text{th} \chi_{i,\text{ex}}

where \Lambda indicates that the D_\text{EI} values are separated into trapped and passing components, the ratio D_\text{EP}/\chi_i is the theoretical value calculated by DEP, and \chi_{i,\text{ex}} is the experimentally determined thermal ion heat diffusivity (e.g., from power balance analysis in TRANSP). The TGLF [109] code determines the linear frequencies, growth rates, and nonlinear spectral weights for the turbulent modes based on the measured plasma profiles, and passes them to DEP for calculation of D_\text{EP}/\chi_i. TGLF is able to resolve ion modes (e.g., ITG, which is dominant in this off-axis case), and electron modes (e.g., TEM, which is dominant across much of the plasma in the on-axis case of Sec. V). Both TGLF and DEP are integrated into TRANSP/NUBEAM, providing the ability to self-consistently account for the energetic ion transport effect of microturbulence throughout the evolution of a shot.

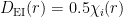
The second method incorporates the analytic expressions for D_\text{EI} as determined by Ref. 87, hereafter referred to as the Pueschel model, where Eqns (12) and (13) are implemented in the present study as,


(2) D_{EI,pass} = \frac{0.292\chi_{eff}}{(v_\parallel/v)^2} \left(\frac{T_e}{E_b}\right)

(3) D_{EI,trap} = \frac{0.527\chi_{eff}\sqrt{\epsilon}}{(v_\parallel/v)[1 - (v_\parallel/v)^2]} \left( \frac{T_e}{E_b}\right)^{3/2},

where these represent the diffusivity due to electrostatic turbulence, \chi_\text{eff} = \chi_e + \chi_i is the effective thermal diffusivity determined by adding the ion and electron contributions, and \epsilon = r/R_o is the inverse aspect ratio with R_o the tokamak major radius (the original work [87] notes that these expressions are meant as approximations to enable systematic studies, so the “=” here represents the fact that these are the exact expressions used to generate D_\text{EI} input for NUBEAM). The Pueschel values are calculated using v_\parallel/v = 0.66 for the passing ions and v_\parallel/v = 0.2 for the trapped ions. These values are representative for the DIII-D beam injection cases. The resulting D_\text{EI} during the time of interest from these two methods are shown in Fig. 8. Diffusivities for the passing ions are given in Figs 8(a) and 8(c). Both D_\text{EI} profiles peak near \rho = 0.6, with the DEP values generally larger than the Pueschel values and exhibiting a faster rolloff with energy. Figures 8(b) and 8(d) illustrate the anomalous diffusivities for the trapped population. The results for the trapped ions are comparable between the two methods.

FIG. 8. Values of energetic ion anomalous diffusivity, $latex D_{EI}$, as calculated by the DEP code for (a) passing and (b) trapped ions, and by the analytic Pueschel expressions for (c) passing and (d) trapped ions.
FIG. 8. Values of energetic ion anomalous diffusivity, D_{EI}, as calculated by the DEP code for (a) passing and (b) trapped ions, and by the analytic Pueschel expressions for (c) passing and (d) trapped ions.
FIG. 9. (a) FIDA spectrum from shot 145183 during the MHD-quiescent period. The experimental spectrum (black trace) is shown with a representative error bar. The classical spectrum (red dashed trace) and the boundaries of the FIDA density integration region are indicated. The inset plot is the experimental data on a semi-log scale to highlight the energetic ion tail (linear portion of plot parallel to dotted blue line). (b) FIDA density as measured (+-symbols) and as expected from classical and turbulent transport models (lines).

All measured energetic ion properties indicate that the transport is classical in this shot. In some cases, modeling based on the energetic ion diffusion enhancement from microturbulence shows that the effects are too small to uniquely resolve compared to the classical values. A FIDA spectrum from the chord centered at R = 1.76 m is shown in Fig. 9(a). The solid line is the experimentally measured spectrum, while the dashed line represents the classically expected value from FIDASIM. A representative error bar is plotted on the measured spectrum, where this represents the statistical uncertainty. Systematic uncertainties are treated in the FIDA density profiles to follow. For the spectrum, Fig. 9(a) highlights the FIDA density integration region of 20 \le E_\lambda \le 40\,keV, where E_\lambda is the Doppler shift energy corresponding to a given wavelength. This range is motivated by the observed presence of an energetic ion tail. The inset plots the measured spectra on a semi-log format in which the energetic tail appears as a linear region (the dotted line is a guide for the eye). It is seen that the tail occurs at Doppler shifts corresponding to wavelengths below 654\,nm. The FIDA contribution at Doppler shifts below 20 keV is poorly resolved because of the large light signals from thermal D_\alpha. The FIDA density, which is calculated by integrating the spectrum and dividing out the radial profile of neutral density due to the injected active-spectroscopy beam source, is given in Fig. 9(b). The +-symbols represent the measured values, and the remaining traces represent the expected profile based on either classical or turbulent transport models. The ribbon about the classical profile represents the 25\% uncertainty in FIDASIM. The measured profile is a good fit to the +25\% edge of the classical profile. These results are obtained entirely independent of one another, i.e., there is no normalization applied within this analysis. In fact, the investigation of possible transport by microturbulence requires that normalizations be avoided since turbulent fluctuations remain present even in otherwise quiescent plasma conditions. Error bars on the measured profile points represent the statistical error, which does not account for systematic uncertainties. In order to consider systematic uncertainty, we find the scaling factor (applied to the measured profile) that produces the lowest value of \chi^2_\text{red}. This amounts to assuming that the shape of the classical synthetic result is more rigidly accurate than the absolute value of the radiance. For the profile shown in Fig. 9(b), a scaling factor of 0.8 produces the minimum value of \chi^2_\text{red} = 12.2. This \chi^2_\text{red} is approximately half the value of the equivalent result performed in the presence of Alfvén eigenmodes (treated in Sec. V).

FIG. 10. FIDA brightness profile from the main ion Da system during off-axis beam injection in shot 145183. The +-symbols represent the absolutely measured brightness, while the *-symbols represent the measured data after being scaled to produce the best-fit to the simulated profile (represented by the dashed line).

Processing the FIDA measurements in terms of profile fitting also avoids possible quantitative issues with FIDASIM, as discussed in the context of the FIDA profile shown in Fig. 10. The FIDA brightness profile of Fig. 10 is calculated based on measurements from the main-ion D_\alpha diagnostic system,[110] which measures the entire D_\alpha spectrum. The displayed profile, though determined with different analysis techniques, represents the energetic ion density through the observed phase space of the diagnostic just as in the FIDA density plot of Fig. 9(b). In Fig. 10, the experimentally measured profile is seen to be considerably larger than the classically expected profile. The best-fit is achieved by a data scaling factor of 0.65, which produces \chi_\text{red}^2 = 7.5 and matches the classical shape. The reason for FIDASIM under-prediction compared to measured signals is presently under investigation, though initial review [111] suggests that possible modifications to the calculation of halo light may resolve the issue. Calculated emission due to the halo contribution dominantly adjusts the amplitude of the FIDA profiles, with less effect on their shape. The profile fitting method employed in this analysis is intended to maintain the applicability of these results even in the case of modifications to the synthetic diagnostic code. A summary of the profile results across all of the studied shots is presented in Sec. VI A.

Share this:

  • Click to email a link to a friend (Opens in new window) Email
  • Click to share on Reddit (Opens in new window) Reddit
  • Click to share on Facebook (Opens in new window) Facebook
  • Click to share on X (Opens in new window) X
  • More
  • Click to share on Tumblr (Opens in new window) Tumblr
  • Click to share on Telegram (Opens in new window) Telegram
  • Click to share on WhatsApp (Opens in new window) WhatsApp
  • Click to share on Pinterest (Opens in new window) Pinterest
  • Click to share on Pocket (Opens in new window) Pocket
  • Click to share on LinkedIn (Opens in new window) LinkedIn
  • Click to print (Opens in new window) Print
Pages: Page 1 Page 2

Filed Under: Research

Reader Interactions

Leave a ReplyCancel reply

Copyright © 2025 · David Pace